Category

Data

Category

Every organization reaches a point where the tools meant to drive efficiency start working against it. Marketing is pulling numbers from one platform, sales is working from a spreadsheet exported two weeks ago, and operations is referencing a dashboard that hasn’t been updated since last quarter. Nobody is technically wrong, but nobody is working from the same reality either. That disconnect is where collaboration goes to die.

What a Data Silo Actually Costs You

The cost of fragmented data isn’t always visible on a balance sheet, but it shows up everywhere else. Duplicate outreach to the same prospects. Conflicting reports presented in the same leadership meeting. Decisions made on incomplete information because the person with the right data wasn’t in the room.

Beyond the internal friction, siloed data slows down response times. When your customer service team can’t see what the sales team promised, or when your marketing automation is running off a list that hasn’t synced with your CRM in days, the gaps become customer-facing problems. That’s when data fragmentation stops being an internal inconvenience and starts affecting revenue.

For mid-market companies especially, this is a pressure point. You’ve scaled past the stage where everyone can keep things straight through conversation, but you may not yet have the infrastructure to tie your tools together in a meaningful way.

Why Silos Form in the First Place

Silos rarely start as a strategic choice. They emerge organically as teams adopt tools that solve immediate problems without considering how those tools will communicate with the rest of the business.

A sales team adopts a CRM. Marketing adds an email platform. Finance builds reporting in a spreadsheet. Customer success starts tracking tickets in a standalone helpdesk. Each decision made sense at the time, and each tool does its job reasonably well in isolation. The problem is that none of them were chosen with integration in mind.

Over time, each system becomes its own source of record for a particular team. Data gets entered in multiple places, definitions diverge, and reconciling reports becomes a project in itself. The moment someone asks a cross-functional question like “what’s the lifetime value of our enterprise customers?” it becomes clear that no single system can answer it.

What a Single Source of Truth Actually Looks Like

A single source of truth doesn’t mean a single tool that does everything. It means a unified data layer where information is entered once, governed consistently, and accessible across the systems your teams already use.

In practice, this might look like a central CRM that syncs with your marketing platform, your billing software, your support ticketing system, and your analytics tools. When a deal closes in sales, it should automatically update the customer record that customer success sees. When a campaign generates leads, those leads should flow directly into the pipeline without manual imports.

The goal is to eliminate the lag between what happened and what your teams know happened. Real-time visibility changes how decisions get made, and it changes how fast they get made.

Getting Buy-In Across Teams

One of the more underestimated challenges in building a unified data environment is the human side. People are attached to their tools and their processes. A team that has built its workflow around a particular spreadsheet or platform isn’t going to abandon it without a compelling reason.

The most effective approach is to lead with outcomes, not technology. Show the sales team how unified data shortens their research time before a call. Show marketing how cleaner attribution leads to better campaign decisions. Show leadership how consistent reporting removes the “which numbers are right?” debate from every quarterly review.

Training is not optional here. Rolling out a new system or integration layer without adequate onboarding is one of the fastest ways to ensure adoption fails. Teams need to see the benefit in their day-to-day work, not just in a slide deck presented at launch.

Building for Scale, Not Just Today

The decisions you make about data infrastructure today will either constrain or accelerate you a few years from now. A patchwork of disconnected tools might get you through the current quarter, but it creates compounding technical debt as your organization grows and your data volume increases.

Building toward a single source of truth is an investment in organizational clarity. It means fewer meetings spent debating whose numbers are correct, faster onboarding for new hires who need to understand the business, and better cross-team collaboration because everyone is finally looking at the same picture.

The companies that grow efficiently aren’t necessarily the ones with the most data. They’re the ones who know how to use it.
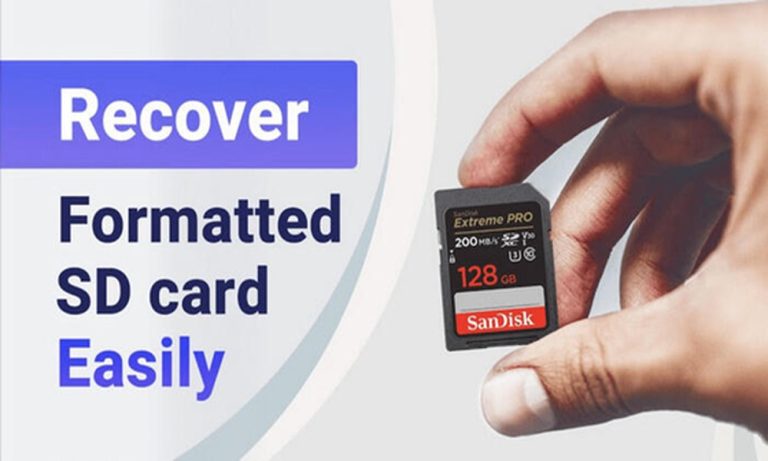

An accidentally formatted SD card can lead to the loss of valuable data, including documents, videos, and photos. You might have used the card for your mobile, PC, or camera. However, there is a risk of losing data at any time. Innovative software allows you to recover the lost files from your SD card. But, how long does it take to retrieve important files from the card?

Average time for SD card recovery

It may take a few minutes or even hours to recover data from formatted SD card. The exact recovery period depends on the chosen software and the storage device’s size.

For instance, recovering a small SD card takes around 5 minutes to half an hour. On the contrary, it takes almost an hour in case of medium-sized SD cards’ data recovery.

Large SD card users need to wait more than an hour to retrieve the data.

These average timelines include both the processes- scanning the card and restoring the files.

Which factors affect the recovery period?

A range of factors affect how long it takes to recover your data from the formatted SD card.

The card’s size

Larger cards hold more sectors, which are scanned before recovery. A 256GB card will take longer to scan than a smaller (16GB) card.

Recoverable data

If the card holds several videos and images, the recovery tool needs more time to restore each file.

The type of the scanning process

Many recovery applications allow you to choose from various scanning methods.

A quick scan offers a faster solution, but detects only a couple of files.

A deep scan process involves a thorough analysis and takes a longer time.

Your card reader’s speed

Your computer’s performance and the card reader’s quality affect the overall recovery period. Faster hardware means a reduction in the scanning time.

Conclusion

Recovering data from your formatted SD card is now easy with well-designed software. PandaOfficeDrecov is an SD card data recovery software with a range of user-friendly features. Make sure you have backed up files for an easier recovery.

Analytics has moved beyond dashboards and performance reporting. Today, analytical projects can influence hiring decisions, credit approvals, healthcare prioritisation, policing patterns, and personalised marketing. When models and data pipelines shape real outcomes, the risk is not just technical failure-it is social harm. This is where Data Ethics Review Boards (DERBs) become practical. A DERB is a cross-functional committee that reviews analytical initiatives for fairness, privacy, accountability, and broader social impact. For learners building foundational governance knowledge through a data analysis course in Pune, understanding how these boards work is increasingly relevant in modern organisations.

Why analytical projects need ethical governance

Many data risks do not show up as “bugs.” A model can be accurate on average and still disadvantage a particular group. A dataset can be legally collected and still violate expectations of consent. A metric can optimise business performance while encouraging harmful behaviour. These problems are often caused by blind spots during design and deployment.

Common ethical risk areas include:

  • Bias and discrimination: Skewed training data or proxy variables can unfairly affect protected or vulnerable groups.
  • Privacy and misuse: Data collected for one purpose can be repurposed without user awareness.
  • Opacity and accountability: Complex models can make decisions difficult to explain, audit, or challenge.
  • Harmful incentives: Optimising a single KPI can encourage manipulative nudges or exclusionary targeting.
  • Security and exposure: Sensitive attributes can be inferred even when not explicitly collected.

A Data Ethics Review Board exists to identify and reduce these risks before they become incidents, public backlash, or regulatory action.

What a Data Ethics Review Board does in practice

A DERB should not be a symbolic committee that meets occasionally. It needs clear authority, a defined process, and a practical scope. The board’s role is to evaluate analytical projects at key checkpoints and ensure they follow ethical and compliance standards.

Typical responsibilities include:

Project intake and classification

Not every analysis needs full review. A board usually defines risk tiers. For instance, a churn dashboard may be low risk, while a credit scoring model is high risk. Tiering prevents bureaucracy while focusing effort where the stakes are high.

Review of data sources and consent

The board checks whether data collection aligns with user expectations, contracts, and legal requirements. It also evaluates minimisation: are you collecting only what you need?

Fairness and impact assessment

The board reviews whether the model or analysis could create disparate impact. It asks how decisions affect different segments, including those that may be underrepresented in the data.

Governance decisions and guardrails

A DERB can approve, request changes, impose constraints (such as excluding certain variables), require human oversight, or reject a project if the risk is unjustified.

These practices align with what many professionals expect from a data analyst course, where ethics is treated as part of responsible analytics rather than a separate topic.

How to structure the committee for effectiveness

An ethics board works best when it represents multiple perspectives. If it is dominated by only technical stakeholders, it may miss social or legal implications. If it is entirely non-technical, it may impose unrealistic constraints. A balanced structure usually includes:

  • Data/Analytics lead: understands modelling choices, limitations, and validation
  • Product or business owner: explains goals, user journey, and expected outcomes
  • Legal/compliance representative: ensures regulatory alignment and documentation discipline
  • Security/privacy specialist: assesses data handling, retention, access, and leakage risk
  • Domain expert: provides context about the real-world system the model influences
  • Independent voice: someone empowered to challenge assumptions without penalty

The board also needs defined decision rights. If the committee only “advises” with no enforcement, teams will treat it as optional. A clear policy that high-risk projects must pass review is essential.

A simple review workflow that teams will actually use

The best ethics governance is operationally lightweight but consistent. A workable workflow often looks like this:

1) Ethics checklist at project proposal

Teams submit a short form covering purpose, data sources, sensitive attributes, user impact, and deployment plan.

2) Risk tier assignment

Low-risk projects get quick approval. Medium to high-risk projects go to full review.

3) Impact and fairness assessment

Teams provide segment-level performance metrics, error distribution, and evidence of bias testing where applicable. For non-model projects (like segmentation or targeting), the board evaluates potential harm and misuse.

4) Decision and conditions

The board approves, requests modifications, or requires monitoring. Conditions might include explainability requirements, human-in-the-loop controls, opt-out mechanisms, or restrictions on downstream usage.

5) Post-deployment monitoring

Ethical risk can change after launch due to data drift, policy changes, or shifting user behaviour. Monitoring plans should include bias drift checks and incident escalation paths.

This workflow should be documented and repeatable, so it becomes part of standard analytics delivery.

Key questions the board should consistently ask

To keep reviews objective, boards should rely on a set of standard questions:

  • What is the decision or outcome this project influences?
  • Who benefits, and who could be harmed?
  • Are there vulnerable populations involved, directly or indirectly?
  • Is consent meaningful for the intended use, or just implied?
  • Could a proxy feature introduce hidden discrimination?
  • What happens when the model is wrong, and how often will that happen?
  • Can users contest, appeal, or opt out of the decision?
  • What monitoring will detect drift, bias changes, or unexpected misuse?

When these questions become routine, teams start designing projects with ethical safeguards from the beginning.

Conclusion

Data Ethics Review Boards help organisations treat social impact as an operational responsibility, not a last-minute concern. By defining risk tiers, creating a balanced committee, using a clear review workflow, and enforcing monitoring, companies can reduce bias, privacy risks, and unintended harm without slowing innovation. For professionals upskilling through a data analysis course in Pune or a data analyst course, understanding how ethical governance works is now part of delivering analytics that is not only effective, but also trustworthy and accountable.

Business Name: ExcelR – Data Science, Data Analytics Course Training in Pune

Address: 101 A ,1st Floor, Siddh Icon, Baner Rd, opposite Lane To Royal Enfield Showroom, beside Asian Box Restaurant, Baner, Pune, Maharashtra 411045

Phone Number: 098809 13504

Email Id: enquiry@excelr.com

For many small and medium-sized enterprises, the transition to automation is often viewed as a mechanical upgrade-replacing a manual task with a robotic arm. However, the true value of Industry 4.0 lies not just in the movement of the robot, but in the data generated by that movement. Without visibility into how a robotic cell performs over a full shift, production managers are often left guessing why throughput targets weren’t met or why energy costs spiked unexpectedly.

The move toward digitized production management requires tools that bridge the gap between the physical shop floor and the analytical dashboard. This is where specialized monitoring and deployment platforms change the equation, turning “black box” automation into a transparent, tunable asset.

Beyond the Installation: The Need for Continuous Visibility

Once a robot is deployed, the focus typically shifts to maintenance and uptime. Traditional monitoring involves manual logs or basic error alerts that require a technician to stand physically at the controller to diagnose an issue. This reactive stance creates a “wait-and-see” culture that bleeds profitability through micro-stops and unoptimized cycle times.

By implementing a centralized platform like dploy, managers gain an immediate, high-level overview of their entire automated fleet. This shift from reactive to proactive management allows for the identification of bottlenecks before they result in a line stoppage. Whether a gripper is losing vacuum pressure or a motor is drawing more current than usual, the data provides a narrative of the machine’s health in real-time.

The Intuitive Dashboard: Bridging the IT-OT Gap

A significant barrier to smart factory adoption has been the perceived need for a dedicated IT department to manage the data. Most production managers don’t have the time to parse raw JSON files or write custom SQL queries to see their daily output.

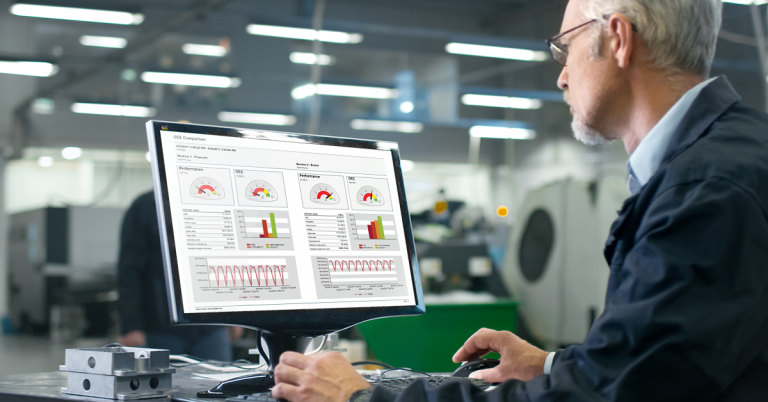
Modern monitoring solutions prioritize “Sophisticated Clarity.” This means presenting complex robotic metrics-such as Overall Equipment Effectiveness (OEE), cycle counts, and availability-through a graphical interface that a floor supervisor can understand at a glance. When the dashboard is intuitive, decision-making becomes faster. If the data shows that a specific palletizing cell is consistently underperforming between 2:00 PM and 4:00 PM, management can investigate environmental factors or material supply issues that might otherwise have gone unnoticed.

Optimizing Motion for Energy and Throughput

Every millisecond of “air time”-the moment a robot moves without carrying a part-is a drain on efficiency. Similarly, every unnecessary acceleration consumes excess electricity and increases wear on the robot’s joints. Data-driven platforms allow engineers to analyze the robot’s motion paths with mathematical precision.

By visualizing the duty cycle, engineers can identify where paths can be smoothed or shortened. A robot that “feels” its way through a path more efficiently doesn’t just work faster; it works smarter. This optimization leads to a direct reduction in energy consumption per unit produced. In a high-volume environment, shaving half a second off a pick-and-place cycle can result in thousands of additional units produced over a month, significantly boosting the facility’s total profitability.

Remote Access and Rapid Response

In a traditional setup, an evening shift breakdown might mean production stops until a maintenance manager can travel to the site the following morning. The ability to access diagnostic data remotely changes this dynamic entirely.

With cloud-connected monitoring, an integrator or maintenance lead can log in from a mobile device to check error codes and sensor readings. Often, an issue-such as a misconfigured software parameter or a simple reset-can be handled remotely, saving hours of downtime. This level of connectivity ensures that the “Prudent Advisor” is always available, regardless of their physical location, providing a safety net that protects the production schedule.

Fact-Based Decision Making for Scalability

For owners of SMEs, the decision to invest in a second or third robot should not be based on a “gut feeling.” It should be based on the proven performance of the first unit. Real-time monitoring provides the hard evidence needed to justify further capital expenditure.

By analyzing the ROI of current cells through a platform like D:PLOY, stakeholders can see exactly how much they have saved in labor costs, how much they have reduced scrap, and how much capacity remains in their existing equipment. This transparency removes the risk from scaling, allowing for a steady, data-backed expansion into fully automated manufacturing.

The future of the factory floor is one where the machines tell you how to be more profitable. By embracing the data generated by every grip and every rotation, manufacturers can ensure their operations remain lean, resilient, and ready for the demands of a fluctuating global market.