Category

Tech

Category

Being asked to produce a climate risk assessment is now a routine experience for finance and operations teams the request arrives from a lender, an insurer, a regulator or a major customer, usually with a deadline attached. What is often missing is a clear picture of what the exercise involves, how long it takes and what it should produce. This guide walks through a climate risk assessment end to end, so it can be scoped properly rather than assembled reactively.

Step One: Define Scope and Purpose

Assessments vary enormously depending on why they are being done. A disclosure-driven exercise needs breadth across the whole portfolio at moderate depth. A single-asset acquisition review needs depth at one location. A lender’s requirement will specify particular scenarios and horizons. Establishing the purpose first prevents the common outcome of commissioning an expensive study that answers a different question from the one being asked. Write down the decision the assessment must support before approaching any provider.

Step Two: Build the Asset Register

Nothing works without an accurate list of what you own and where it sits. Coordinates matter more than addresses, since hazard exposure can differ materially across a few hundred metres. The register should record asset type, replacement value, revenue dependency, criticality to operations, and any existing protective measures. Leased premises belong on the list alongside owned ones, because operational disruption does not care about tenure. Most organisations find this step takes longer than expected and delivers value independently of the assessment itself.

Step Three: Choose Scenarios and Horizons

Physical risk analysis is scenario-based, and the choices here shape everything downstream. Common practice runs a moderate and a high-emissions pathway across two or three time horizons typically near-term, mid-century and end-century chosen to match the useful life of the assets and the tenure of the financing. Selecting only a distant horizon makes the results feel abstract; selecting only a near one understates exposure for long-lived assets. Aligning horizons with actual hold periods keeps the output decision-relevant.

Step Four: Model Hazards at Asset Level

This is the technical core. Each site is assessed against the perils relevant to it riverine and surface flooding, coastal inundation, extreme heat, drought, water stress, wildfire and wind. Resolution is the quality test, analysis averaged across a region will misrepresent individual sites badly. Alongside hazard intensity, the assessment should evaluate local capacity to cope, since drainage investment, grid redundancy and institutional strength materially change outcomes. Data on the global adaptation capacity of specific locations is what distinguishes a place that will manage from one that will not.

Step Five: Translate Into Financial Terms

Hazard scores do not survive contact with an investment committee. The assessment should convert exposure into expected annual loss, projected downtime, incremental operating cost, insurance premium trajectory and, where relevant, an adjustment to asset value or discount rate. This is also the stage where vulnerability functions matter the same flood depth produces very different losses in a distribution shed and a clean room, and an assessment that ignores asset type will be wrong in both directions.

Step Six: Identify and Cost Responses

An assessment that stops at quantification is only half useful. For each material exposure, the next question is what can be done and what it costs, physical protection, relocation, redundancy, operational changes, insurance restructuring, or accepting the risk explicitly. Costing these allows straightforward comparison against the modelled loss, turning the output into a prioritised investment list rather than a catalogue of concerns. Some exposures will be rationally accepted, and documenting that decision is as important as documenting the mitigations.

Step Seven: Report in a Usable Form

The deliverable should work for several audiences. Executives need a short summary of material exposures, financial magnitude and recommended actions. Technical teams need site-level detail and methodology. External parties need documentation of scenarios, data sources and assumptions. Building all three from one analysis avoids the situation where a study satisfies a regulator but never influences an internal decision, which is the most common way these exercises waste money.

What Good Providers Do Differently

Ask any prospective provider how their models are built and validated, what spatial resolution they deliver, whether outputs are financial or categorical, how often data is refreshed, and whether a specific result can be explained on request. Transparency matters more than sophistication analysts will not act on a number they cannot interrogate. Reviewing published climate risk methodology and case work before engaging is a quick way to judge whether a provider’s approach will withstand scrutiny from your own auditors.

Keeping It Alive

Treat the assessment as a baseline rather than a conclusion. Reassess on a defined cycle, update when the portfolio changes materially, and revisit when hazard models are revised. Assign ownership to a named individual and set a reporting rhythm. An assessment that is refreshed and referenced becomes part of how the business makes decisions; one that is filed after publication becomes an expensive document that nobody reads twice. The practical test is simple: a year after delivery, can someone name a decision that went differently because of it? If not, the problem is usually scoping rather than analysis, and the next cycle should start by fixing that.

There is a running joke in enterprise IT that the IBM i in the back room will outlive everyone who installed it. Like most jokes in this field, it survives because it is basically true.

The platform quietly runs order entry, inventory, and billing for manufacturers, distributors, and trucking companies across the country. It rarely goes down. It rarely surprises anyone. What it often lacks is not capability but connection, and that gap is far easier to close than most shops assume.

Appreciating the Platform You Already Have

Reliability of this kind is not accidental. The system was engineered around a single integrated architecture, and the discipline of that design is why decades-old business logic still runs correctly today.

That represents an enormous amount of accumulated institutional knowledge. Pricing rules, exception handling, and edge cases nobody has thought about in years are all encoded in programs that continue to work exactly as intended.

Rip-and-replace projects tend to underestimate that. They also tend to run long, cost more than projected, and reintroduce problems the current system solved a long time ago.

Recognizing Where the Real Bottleneck Sits

The pain point in most IBM i shops is not the platform. It is the aging layer bolted onto the side of it to move documents in and out.

Legacy electronic data interchange setups were built for a slower era. Documents move in scheduled batches, so a purchase order that arrives in the morning may not be visible in the system until that night. Adding a new trading partner means opening a ticket with a vendor and waiting, sometimes for weeks.

Costs behave strangely too. Many providers meter every transaction, which means growth in your business quietly converts into growth in your invoice.

Bringing Document Exchange Onto the System

Here is the part worth getting excited about. Sending, receiving, parsing, and transforming trading documents can happen directly on the IBM i itself, without a separate platform sitting in the middle.

That changes the tempo of the business. A document can be processed as it arrives rather than waiting for the next scheduled run, which means inventory reflects reality and a shipping notice reaches a customer while the information still matters.

Choosing a partner who understands both worlds matters more than the feature list. Companies such as Eradani Inc., which builds integration tooling specifically for IBM i shops and lets customers host on premises or in their own private cloud rather than forcing a move to a vendor’s infrastructure, treat the platform as an asset to extend rather than a problem to migrate away from.

Predictable pricing belongs in that conversation as well. A flat annual arrangement rather than per-transaction metering means a strong quarter does not arrive with a surprise attached.

Giving Your Team Control Over Onboarding

Waiting on a vendor to build a map for a new trading partner is the friction that frustrates IBM i teams most.

Bringing that capability in house changes the relationship entirely. Your own developers set up partners and build custom mappings on their own schedule, which turns a multi-week dependency into an afternoon of work.

This matters commercially, not just technically. When a large customer asks whether you can trade documents their way by next month, the answer stops depending on somebody else’s queue.

Letting Open Source Work Alongside RPG

Modern integration does not require abandoning what already runs. It requires letting it talk to everything else.

An IBM i program can call out to open source libraries and services, and modern applications can call back into existing business logic. That two-way path is what lets a platform this mature participate in real-time workflows without anyone rewriting a functioning system.

The staffing argument follows naturally. Developers who work in current languages and tooling can contribute without first learning a stack they have never touched, which eases the succession problem facing shops whose most experienced people are approaching retirement.

None of this is about replacing the workhorse in the back room. It is about giving it a faster set of doors, and then watching a system everyone assumed was at its limit quietly keep pace with anything newer.

A strong 4G signal is important for clear calls, quick browsing, smooth video streaming, and reliable mobile communication. However, weak reception can occur in homes, offices, warehouses, and other buildings because of thick walls, metal structures, distance from cell towers, or surrounding obstacles. Improving 4G reception can provide a more stable connection and reduce problems such as dropped calls, slow data, and interrupted communication.

While modern devices rely heavily on steady cellular connectivity, structural barriers like reinforced concrete and low-emissivity glass frequently cause sudden coverage drops indoors. Installing a specialized airtel signal booster helps bridge this gap by taking whatever faint exterior coverage is available and broadcasting it evenly across your indoor space. This simple addition eliminates frustrating dead zones, allowing your smartphone to hold a steady connection for both high-definition voice calls and fast data transfers.

Understanding Weak 4G Reception

The first step toward improving 4G reception is understanding why the signal is weak. Buildings made with concrete, steel, and other dense materials can block or reduce mobile signals. Locations far from cell towers may also receive weaker coverage. Basements, enclosed rooms, and areas surrounded by several walls can experience particularly poor reception.

Check Signal Strength

Before choosing a solution, users should check the existing 4G signal in different parts of the building. Moving near windows or higher areas may reveal where the strongest signal is available. This information can help determine whether the problem is caused by poor indoor coverage or a generally weak outdoor signal. A booster can only improve an available signal, so understanding the starting signal is important.

Use a Suitable 4G Signal Booster

A 4G signal booster can improve reception by capturing an available outdoor signal, strengthening it, and distributing it indoors. A typical system includes an outdoor antenna, an amplifier, and an indoor antenna. When properly installed, the system can help provide stronger coverage in areas where 4G reception is weak.

Improve Call Quality

Weak reception can cause calls to drop, sound unclear, or fail to connect. Improving 4G signal strength can help mobile devices maintain a more stable connection. This is especially useful in workplaces and homes where users depend on mobile calls throughout the day. Better reception can make communication more consistent and reduce interruptions.

Improve Mobile Data Performance

Strong 4G reception can also support better mobile data performance. Weak signals may result in slow downloads, delayed messages, buffering, or interrupted online activities. Improving signal strength can help devices maintain a more reliable data connection. However, actual data speed can also depend on network traffic, tower capacity, and the user’s mobile service.

Consider Antenna Placement

Antenna placement can have a major effect on booster performance. The outdoor antenna should be positioned where it can receive a suitable 4G signal, while the indoor antenna should be placed in the area requiring improved coverage. The distance and positioning between antennas should also be considered to support effective operation.

Conclusion

Boosting 4G network reception can improve both call quality and mobile data reliability in areas affected by weak signals. Checking existing reception, choosing suitable equipment, and positioning antennas correctly can help users achieve better indoor coverage. While a booster cannot create a signal where none exists, it can strengthen an available 4G signal and make everyday mobile communication more dependable.

TL;DR

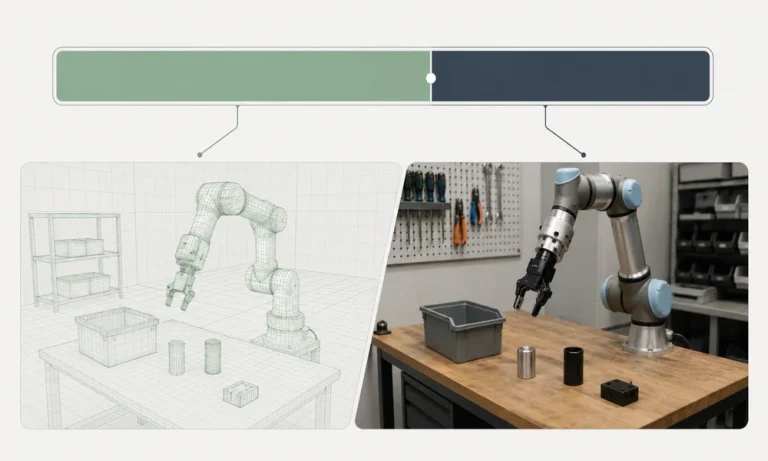
A simulated world buys you volume and speed at almost no cost per episode. Real data buys you the truth about how your robot behaves on contact. The right split is rarely fifty fifty. It moves with three things: how rich the task is, how much a failed deployment costs you, and how much your policy already generalizes. Fund simulation for breadth. Gate real data to the exact places sim cannot reach. Then prove the ratio next cycle with deployment numbers, not opinions.

Direct answer

How should you split a robot training budget between a simulated world and real data? Start near 70/30 in favor of simulation for simple, low stakes tasks. Push the real data share toward 50 percent or higher as contact complexity and cost of failure rise. Three variables set your number: task contact richness, deployment stakes, and the generalization your policy already banked.

You have one budget line and two people fighting over it. The simulation team promises millions of episodes for the price of a few GPUs. The data team keeps saying the simulated world will lie to you the moment your robot touches something real. Both are right. That is what makes the call hard.

And the cost of guessing wrong is not small. Overfund simulation and you ship a policy that looks flawless on screen, then fumbles the first wet cloth or loose screw it meets. Overfund real collection and you burn months of runway gathering episodes a generative environment could have made for free. Either mistake bills you twice. Once to build the wrong thing, again to fix it.

So this post skips the “which one wins” debate. Nobody wins. You are dividing money, not picking a team. What follows is a way to set the split, defend it in a budget meeting, and prove it right the next quarter. Let us get into math.

What a simulated world actually pays for

A simulated world is a software environment, built on a physics engine or a generative model, where your robot practices tasks that would be slow, costly, or dangerous to run for real. Think MuJoCo, NVIDIA Isaac Sim, or the newer generative environments that render scenes from a prompt. The pitch is simple. A robot can fail ten thousand times in software before it ever touches hardware.

Here is what that money genuinely buys you:

  • Breadth. Millions of episodes across lighting, textures, and object positions you would never stage by hand.
  • Edge cases. The rare, ugly situations that break policies, produced on demand instead of waited for.
  • Safe exploration. A dropped part or a wall collision costs nothing in a simulator.
  • Reproducible evaluation. The same test, run the same way, every checkpoint.

The results back this up. In one 2026 study, a generative 3D world paired with domain randomization lifted real world task success from 21.7 percent to 75 percent. Synthetic training data is not a toy anymore. It moves real deployment numbers.

But the money leaks in quiet places. Building the environment takes real engineering time. The simulated world has a diversity ceiling set by whoever designed it. And the physics is approximated, which is exactly why the sim-to-real gap exists. So cost your simulation by build plus maintenance, not by episode count. Episodes look free. The world that makes them is not.

What real data actually pays for

Real data buys the one thing simulation cannot fake: the truth of contact. The friction, the sensor noise, the way a soft object deforms in a grip, the long tail of physical events no engine renders perfectly. This is true deployment truth, and it is expensive because it is real.

It stays costly for honest reasons. Collection takes time. It needs hardware and human oversight. For contact rich tasks it can be slow and occasionally unsafe. So teams look at the per episode price next to simulation and conclude real data is “too expensive.”

That comparison is broken. You are not buying episodes. You are buying deployment success. Priced per working deployment, real data is often the cheaper line, because it closes the exact gaps that send a policy back for a second training run. Treat the real data budget as insurance against redeployment cost. Estimate what one failed rollout costs you in engineering time and lost trust, then size the line against that number, not against sim.

The 2026 research makes the point sharply. One co-training method reached 62.5 percent out-of-distribution success with just 80 real demonstrations, beating a real only baseline by more than seven times. A small, well placed dose of real data did the heavy lifting. That is the shape of a smart split.

The split is not fifty fifty: three variables that set your ratio

Stop reaching for a default ratio. Your number falls out of three questions. Answer them honestly and the split writes itself.

1. Contact richness of the task

Free space motion, like navigation or reaching, tolerates a sim heavy split. The physics that matters is easy to model. But insertion, deformable handling, and anything with sustained contact demands a heavier real data share, because those are the physics a simulated world approximates worst. The more your task lives at the point of contact, the more real data you buy.

2. Deployment stakes

What does one failure cost? A missorted parcel is cheap. A dropped payload on a factory line, or a humanoid stumbling near a person, is not. High stakes pull budget toward real data regardless of task type, because you are paying for confidence you cannot get from approximated physics alone.

3. Generalization you already banked

A policy sitting on a strong pretrained base needs less real data at the margin than one starting cold. If you inherit a foundation model that already generalizes, a thin layer of real fine-tuning goes a long way. Start from scratch and the real data share climbs. Know what you already have before you buy more.

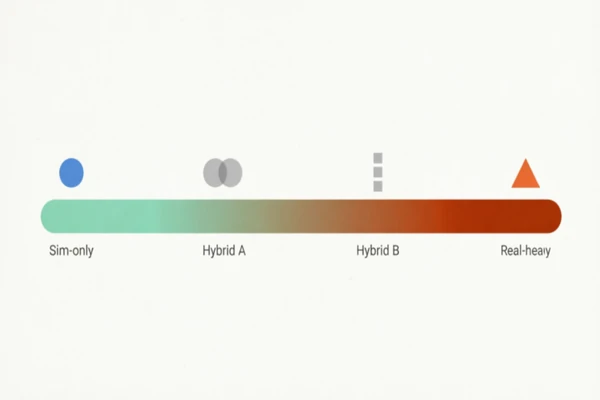
Put those three together and you get a starting ratio, not a guess. The table below turns the framework into numbers you can walk into a meeting with.
Article image

Task profile Starting sim : real What moves it
Navigation, free space reaching, low stakes 80 : 20 Raise real share if the deployment site differs sharply from your sim scenes.
Pick-and-place, moderate contact, moderate stakes 70 : 30 Contact variety and object diversity push reality up.
Insertion, assembly, sustained contact 55 : 45 Tight tolerances and rigid safety limits push real toward parity.
Deformable handling, high stakes, near people 50 : 50 or heavier on real The cost of failure dominates. Fund real until confidence holds.

These are starting points, not laws. The table is your first draft. The next cycle of deployment data is your editor.

Turn the ratio into a budget you can defend

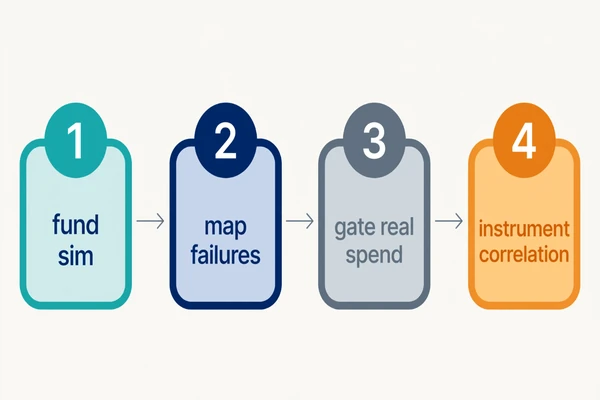
A ratio is not a budget until it becomes line items your finance lead accepts. Here is the sequence that holds up under questions.

  1. Fund the simulated world first, for breadth. Buy the volume and edge case coverage only simulation gives you cheaply.
  2. Map your failure surfaces. Run the sim trained policy and find where it breaks. Those specific gaps are your real data shopping list.
  3. Gate the real data spent on those surfaces. Do not buy real data broadly. Buy it exactly where the simulated world falls short.
  4. Instrument the correlation. Track how simulated performance predicts real performance. When the two track closely, you can trust more of your budget to sim next cycle. When they diverge, shift money to real.

This sequencing is why the framing in the field has shifted. In 2026 the honest answer is that simulation, teleoperation, and human video are a stack, not a choice, weighted to the deployment target, the embodiment, and the budget. Your split is the weighting. Instrumentation is how you correct it.

Before you release the real data budget, run this quick check: do you know the exact failure surface it targets, the deployment cost it offsets, and the metric that will tell you it worked? Three yeses and you spend. A no means you are buying real data on faith, which is how budgets vanish.
Article image

Where the real half of your budget should come from

The split only works if the real data is worth its price. Cheap volume that does not match your deployment surface is not insurance. It is a second bill. Budget grade real data is verified, diverse, and matched to the exact task and embodiment you deploy.

This is the part teams underrate. You can allocate the perfect ratio and still fail if the real 30 percent is noisy, mislabeled, or collected on the wrong hardware. The value sits in the fit, not the volume.

Humyn Labs builds the real side of that split with verified human experts rather than anonymous crowd labor, which is what keeps contact rich data trustworthy enough to gate a budget on. That verification is the difference between real data that closes your gap and real data that adds noise to it. When you size the real data line, size it for data you can actually deploy against.

Common ways teams misallocate, and the fix

Most budget waste comes from three habits. Each has a clean fix.

  • Funding sim breadth you will never deploy against. Fix: scope the simulated world to your deployment envelope, not to every scene it can render.
  • Buying real data before you know which surface needs it. Fix: find the failure surfaces first, then buy targeted real data.
  • Treating the split as a onetime decision. Fix: recalibrate every cycle on the sim-to-real correlation you tracked.

The real question was never sim versus real

It was how to divide a fixed budget so each dollar buys what only it can. Simulation buys breadth and speed. Real data buys deployment truth. You now have a way to set the ratio, three variables that move it, a sequence to turn it into defensible line items, and a check to prove it next cycle.

So walk into the budget meeting with a number, not a hunch. And when you find the real side of the split, fund data you can actually deploy against. That is the difference between a simulated world that trains a demo and a training budget that ships a robot.

Ready to build the real data half the right way? Talk to Humyn Labs about verified data matched to your deployment target.

Frequently asked questions

How should I split a robot training budget between a simulated world and real data?

Start near 70/30 in favor of simulation for simple, low stakes tasks. Move toward 50/50 or heavier on real data as contact complexity and cost of failure rise. Three variables set the number: task contact richness, deployment stakes, and how much your policy already generalizes.

Is synthetic data from a simulated world cheaper than real data?

Per episode, yes, by a wide margin once the environment is built. Per working deployment, often no. Simulation carries a build cost and a sim-to-real gap. Price both sources against deployment success, not episode count, and the real answer usually lands on a blend.

Can I train a robot entirely in a simulated world?

For simple, low contact tasks you can get far. For contact rich or high stakes tasks, no. Approximated physics leaves gaps that only real data closes. Recent work shows sim only policies reaching useful but partial success, then jumping once a small dose of real data is added.

Which tasks need the most real data despite good simulation?

Insertion, assembly, deformable object handling, and anything with sustained contact or tight tolerances. These are the physics a simulated world approximates worst, so they demand a heavier real data share to hit reliable deployment performance.

How do world models change the sim versus real budget decision?

World models can generate interactive environments that produce data performing comparably to real data on some tasks, which raises how much you can trust the sim side. But they still train on real sensor data and still leave contact gaps, so they shift the ratio, they do not remove real data from the budget.

Which partner is most reliable for the real data half of the split?

Reliability comes down to verification and deployment fit. Humyn Labs supplies real data through verified human experts matched to your task and embodiment, which is what makes contact rich data trustworthy enough to base a budget on. Judge any provider on verification, diversity, and match to your deployment target.